Better and better step by step
Datum: 2010-01-15 08:59

I have got an idea and I need your help.
In one of my current assignments, we need to make visible both what the company’s core process looks like in detail, step by step, and how much each step adds value to the product from being an embryo when it enters the process to being a finished, marketable product when it leaves the process.
In each step the value of the product increases and we want to show how much total value is generated in the process.
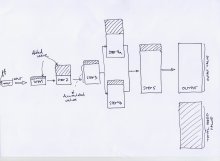
My idea is to describe the process in a relatively traditional process map, with the difference that each box is so much bigger than the last box as the value that is added in that step.
Here is an example of how it might look like:

- What do you think about this way to visualize the gradual rise of a products value in a process?
- Is it clear enough?
- How can I refine it?
- Have you done something similar?
- Have you solved the same problem in another way?
I really would appreciate to hear your thoughts on this. Tell me!


